-
Shop
- Adidas
- Advanced Technologies
- Bathroom
- Best-Sellers
- Car Accessories
- Dating & Social Skills
- Digital Resources
- AI & Technology
- AI Skills
- Beauty
- Budgeting & Saving
- Car Buying & Ownership
- Cozy Feast Collection
- Electronics & Technology
- Emotional Intelligence
- Entrepreneurship & Business Growth
- Financial Education
- Financial Independence
- Financial Mindset & Psychology
- Goal Setting
- Home Styling & Organization
- Kitchen & Recipes
- Leadership
- Mindfulness
- Mindset
- Motivation
- Online Business
- Parenting & Child Development
- Personal Style & Fashion
- Pet Lifestyle & Wellness
- Positive Thinking
- Productivity
- Self Confidence
- Sleep Improvement
- Smart Life with AI
- Stress Management & Relaxation
- Travel Planning
- Wellness
- Yoga & Fitness
- Yoga & Mind-Body Practices
- Easter Products
- Education & Learning
- Family & Parenting
- Fashion
- Alexander McQueen
- Bags
- Bags & Wallets
- Balenciaga
- Belts
- Blazers
- Bottega Veneta
- Brunello Cucinelli
- Burberry
- Chanel
- Chloé
- Dior
- Dolce & Gabbana
- Dresses
- Etro
- Fendi
- Gucci
- Hats & Hair Accessories
- Jewelry
- Jil Sander
- Keychains
- Kiton
- Luggage
- Miu Miu
- Off-White
- Outerwear
- Prada
- Rick Owens
- Saint Laurent
- Shoes
- Socks & Tights
- The Row
- Tom Ford
- Valentino
- Valentino Garavani
- Versace
- Vivienne Westwood
- Watches
- Furniture
- Gadgets
- Health & Beauty
- Health & Wellness
- Home & Garden
- Home Electronics
- Kids & Babies
- Kitchen
- Lighting
- Patio, Lawn & Garden
- Personal Growth
- Pet Care
- Pet Supplies
- Pets
- Smart Home Living Guides
- Sport & Outdoors
- Stress Relief & Relaxation
- TikTok Growth & Monetization Mastery
- Travel
- Wealth
- Wealth Building
- Popular
- Best deals
Housing Market ETFs: A Toolkit to Compare and Buy
Why housing market ETFs need a toolkit approach
Housing-related ETFs can react fast to changes in mortgage rates, credit availability, construction momentum, and buyer affordability. Without a repeatable process, it’s easy to over-weight short-term headlines (a hot inflation print, a sudden rate dip, a single earnings miss) and under-weight slower-moving structural signals like permitting trends, balance-sheet stress, or shifting credit spreads.
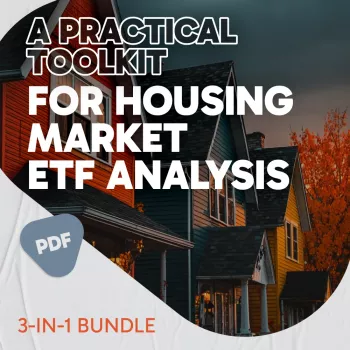
A practical toolkit—built around a guide, a checklist, and a reference-style ebook—helps keep comparisons consistent across funds and market cycles. It also makes it easier to document what mattered at the time of purchase, what would change the thesis, and which signals deserve a review.
What drives housing-focused ETFs
Housing ETFs aren’t all “the same trade.” A homebuilder-heavy ETF tends to behave like a cyclical equity basket tied to margins, backlogs, and demand volume. A mortgage REIT ETF can behave more like a rates-and-spreads instrument, where funding costs and duration risk dominate. Before comparing tickers, identify the exposure type and the primary driver.
- Interest-rate sensitivity: Mortgage rates, yield-curve changes, and refinancing activity often feed through to homebuilders, mortgage REITs, and related financials.
- Affordability and demand: Income growth, prices, and inventory levels can shift the volume outlook for builders and housing services firms.
- Supply-side constraints: Land, labor, materials, permitting timelines, and regional bottlenecks influence margins and delivery schedules.
- Credit conditions: Lending standards, delinquency trends, and securitization liquidity can affect housing finance exposure in certain ETFs.
- Policy and tax impacts: Zoning changes, government-backed lending programs, and incentives can alter demand or profitability.
Common housing ETF exposures and what to check first
| Exposure type | Typical holdings | Primary risk factor | Quick metric to review |
|---|---|---|---|
| Homebuilders | Residential construction companies | Cyclical demand & input costs | Backlog, gross margin trend |
| Housing services | Suppliers, retailers, building products | Renovation cycle & pricing power | Same-store sales / volume indicators |
| Mortgage REITs | Agency/non-agency MBS portfolios | Duration & spread risk | Net interest spread, leverage |
| Real estate (residential tilt) | REITs with residential exposure | Rent growth & cap rates | NOI growth, occupancy |
A repeatable analysis workflow
A consistent workflow keeps ETF research from turning into a grab-bag of charts. The goal is to move from “what’s happening in housing?” to “what does this specific fund own, and what risks dominate?” in a predictable order.
- Define the role in a portfolio: Is it a tactical rate play, a long-horizon housing growth exposure, an income sleeve, or a diversifier?
- Classify the ETF’s true drivers: Identify whether performance has historically tracked rates, credit spreads, equity beta, or home price dynamics.
- Run a macro snapshot: Track mortgage rate direction (for example, 30-Year Fixed Rate Mortgage Average on FRED), housing starts/permits, inventory, and consumer confidence signals.
- Move from top-down to fund-level: Review holdings concentration, subsector weights, geographic tilts, and liquidity (bid-ask spread and average volume).
- Document assumptions and triggers: Define what would invalidate the thesis (rate shock, margin compression, credit spread widening) and what confirms it (improving permits, stabilizing affordability).
For construction activity, the U.S. Census Bureau’s New Residential Construction release is a helpful anchor for starts and permits. For home price context, the S&P CoreLogic Case-Shiller U.S. National Home Price Index on FRED helps keep “price narrative” grounded.
Fund-level checklist: what to examine before buying
- Index and methodology: Understand the rules, rebalance schedule, and whether the index is market-cap weighted, equal weighted, or factor tilted.
- Holdings quality: Review top-10 concentration, exposure to highly leveraged firms, and dependence on narrow revenue streams.
- Costs and friction: Expense ratio, tracking difference, turnover, tax efficiency, and liquidity—especially for niche funds.
- Risk profile: Historical drawdowns, volatility, correlation to broad equity indices, and rate sensitivity.
- Income characteristics (if relevant): Dividend stability, payout sources, and whether distributions depend on leverage.
Key metrics to compare across housing ETFs
- Performance context: Compare returns across multiple regimes (rising-rate vs falling-rate periods), not just one trailing window.
- Valuation and profitability (equity-heavy funds): Weighted average P/E, free cash flow direction, and margin resilience.
- Balance-sheet stress signals: Debt-to-equity, interest coverage, and refinancing needs among major holdings.
- Liquidity and execution: Typical bid-ask spread and market depth; consider staged entries if spreads widen in volatility.
- Scenario testing: Estimate how a 50–100 bps mortgage-rate move or spread widening could translate into ETF volatility.
Turning analysis into decisions: entries, sizing, and risk controls
Strong analysis becomes useful when it changes how positions are entered, sized, and reviewed.
Using the 3-in-1 toolkit (guide + checklist + ebook) for consistency
Recommended digital resources (in stock)
- A Practical Toolkit for Housing Market ETF Analysis | 3-in-1 Guide, Checklist & Ebook
- Turn an Old Car Into a Smart Tax Move: A Complete Checklist for Donating Your Car to Charity for a Tax Write-Off
- How Essential Oils Can Ease Stress and Anxiety | Relaxation eBook Guide for Natural Stress Relief, Aromatherapy, and Anxiety Support
Common pitfalls to avoid
FAQ
What indicators matter most when reviewing a housing market ETF?
Mortgage rates and financing conditions, starts and permits, inventory and affordability, and credit spreads tend to matter most. Then link those indicators to what the ETF actually holds (builders vs services vs REITs) to identify the dominant driver.
How can housing ETFs be compared fairly if they hold different types of companies?
Classify the exposure type first, then compare costs and liquidity, concentration, and scenario sensitivity to rates and credit. Evaluate performance across multiple market regimes rather than relying on one time period.
How often should a housing ETF thesis be reviewed?
A monthly macro check-in helps catch shifts in rates, affordability, and construction trends early. A quarterly deeper review is useful for holdings changes, index rebalances, tracking difference, and whether predefined thesis triggers were hit.
Recommended for you


Debt Payoff Budget Checklist: Weekly Plan That Works
Jul 21, 2026













Leave a comment